Simplifying data visualization and scientific publishing

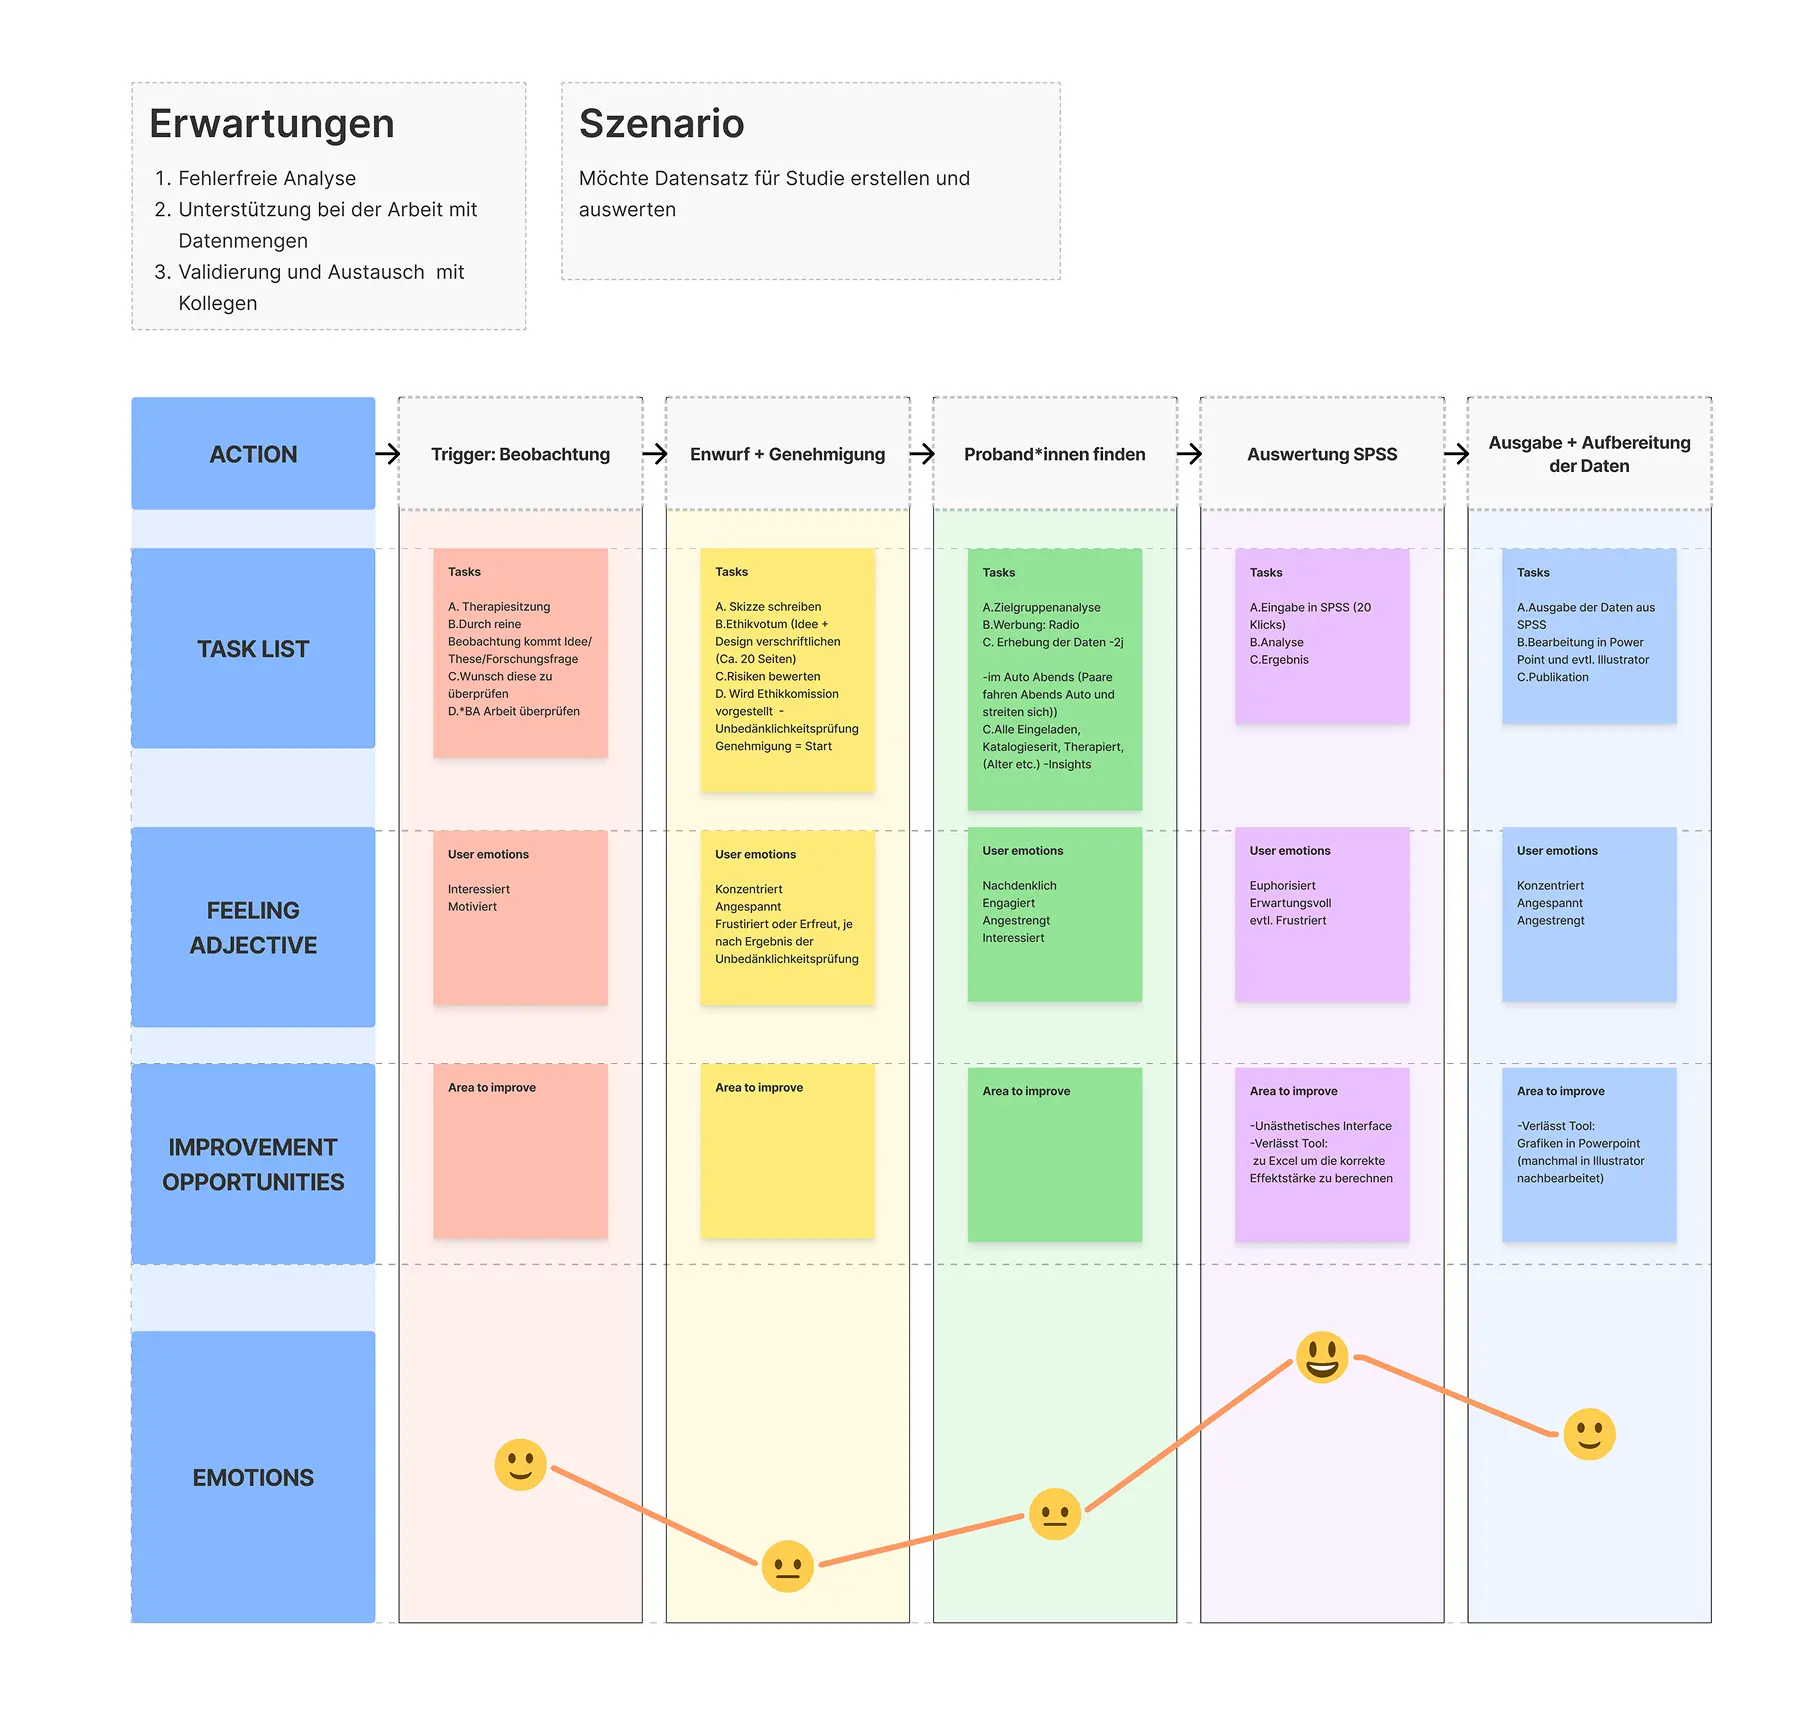
This project explores how established data analysis software can better support contemporary scientific work. Using SPSS as a case study, it examines how statistical workflows, data visualization, and academic publishing can be more closely integrated through interaction design.
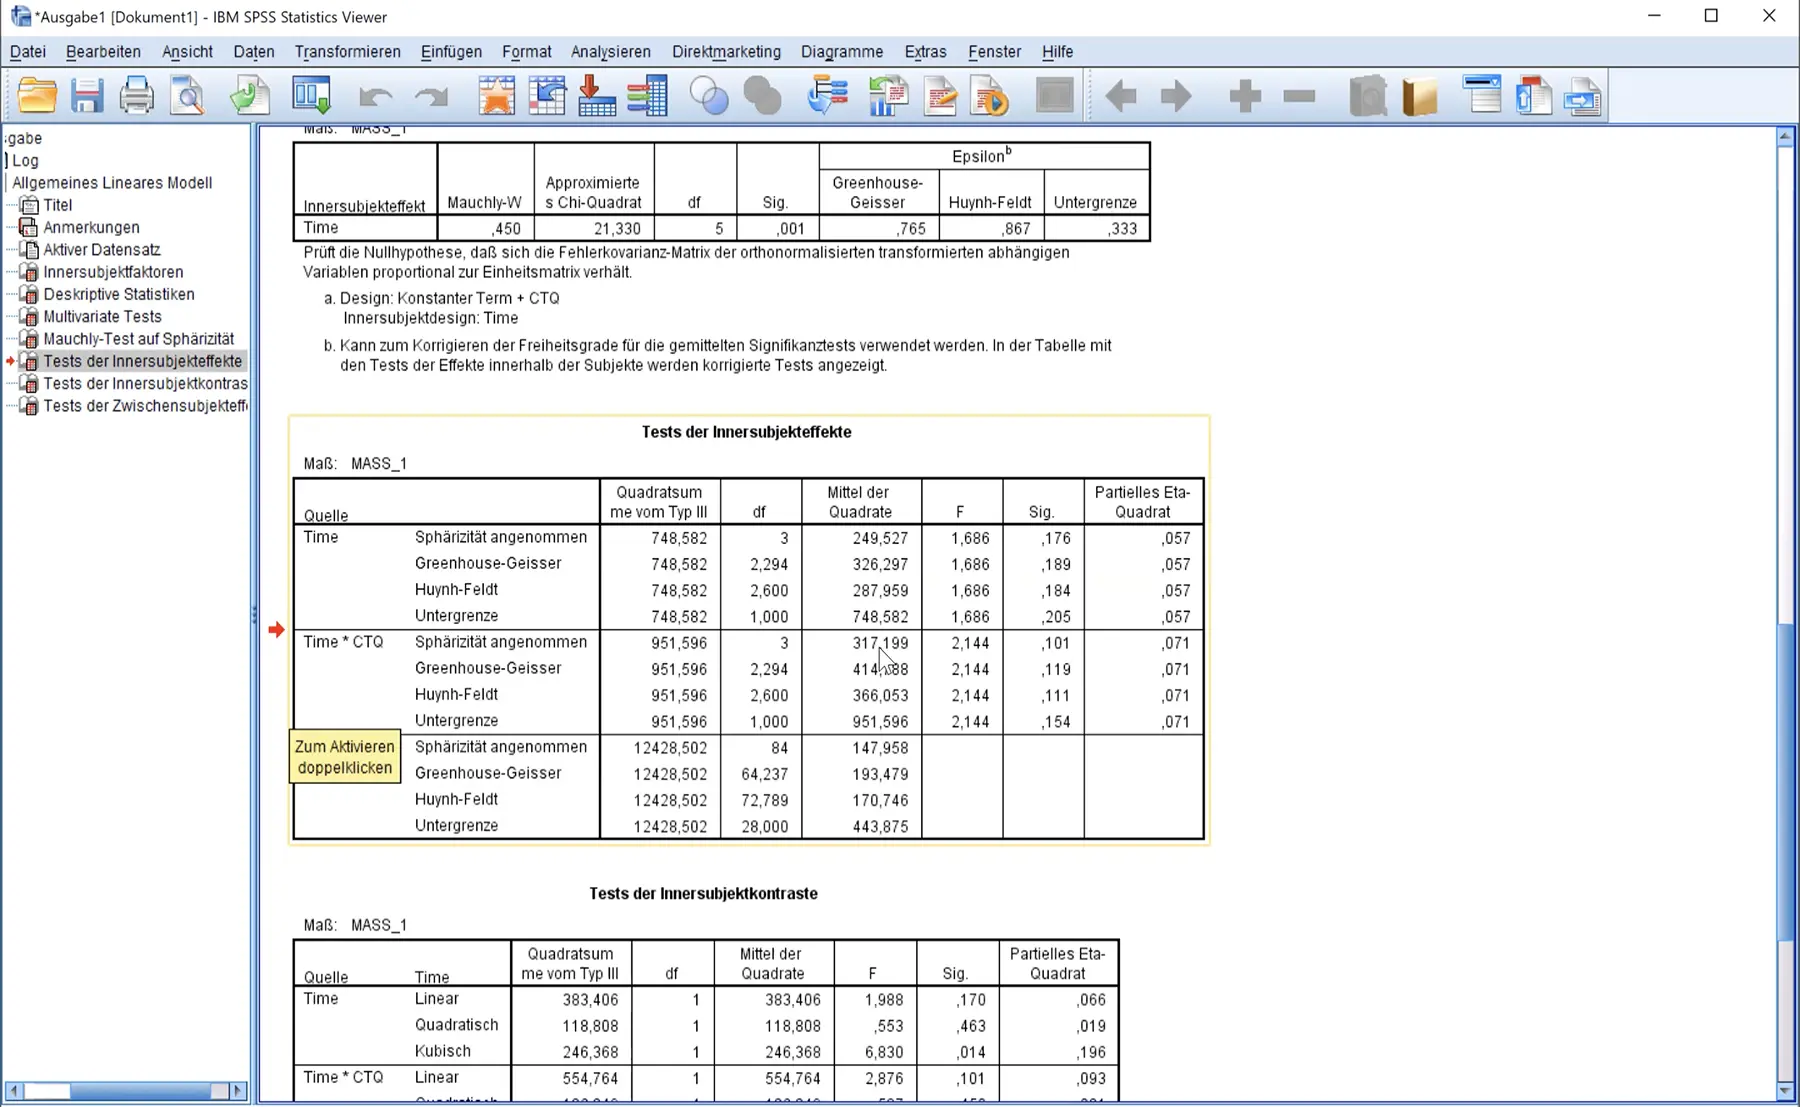
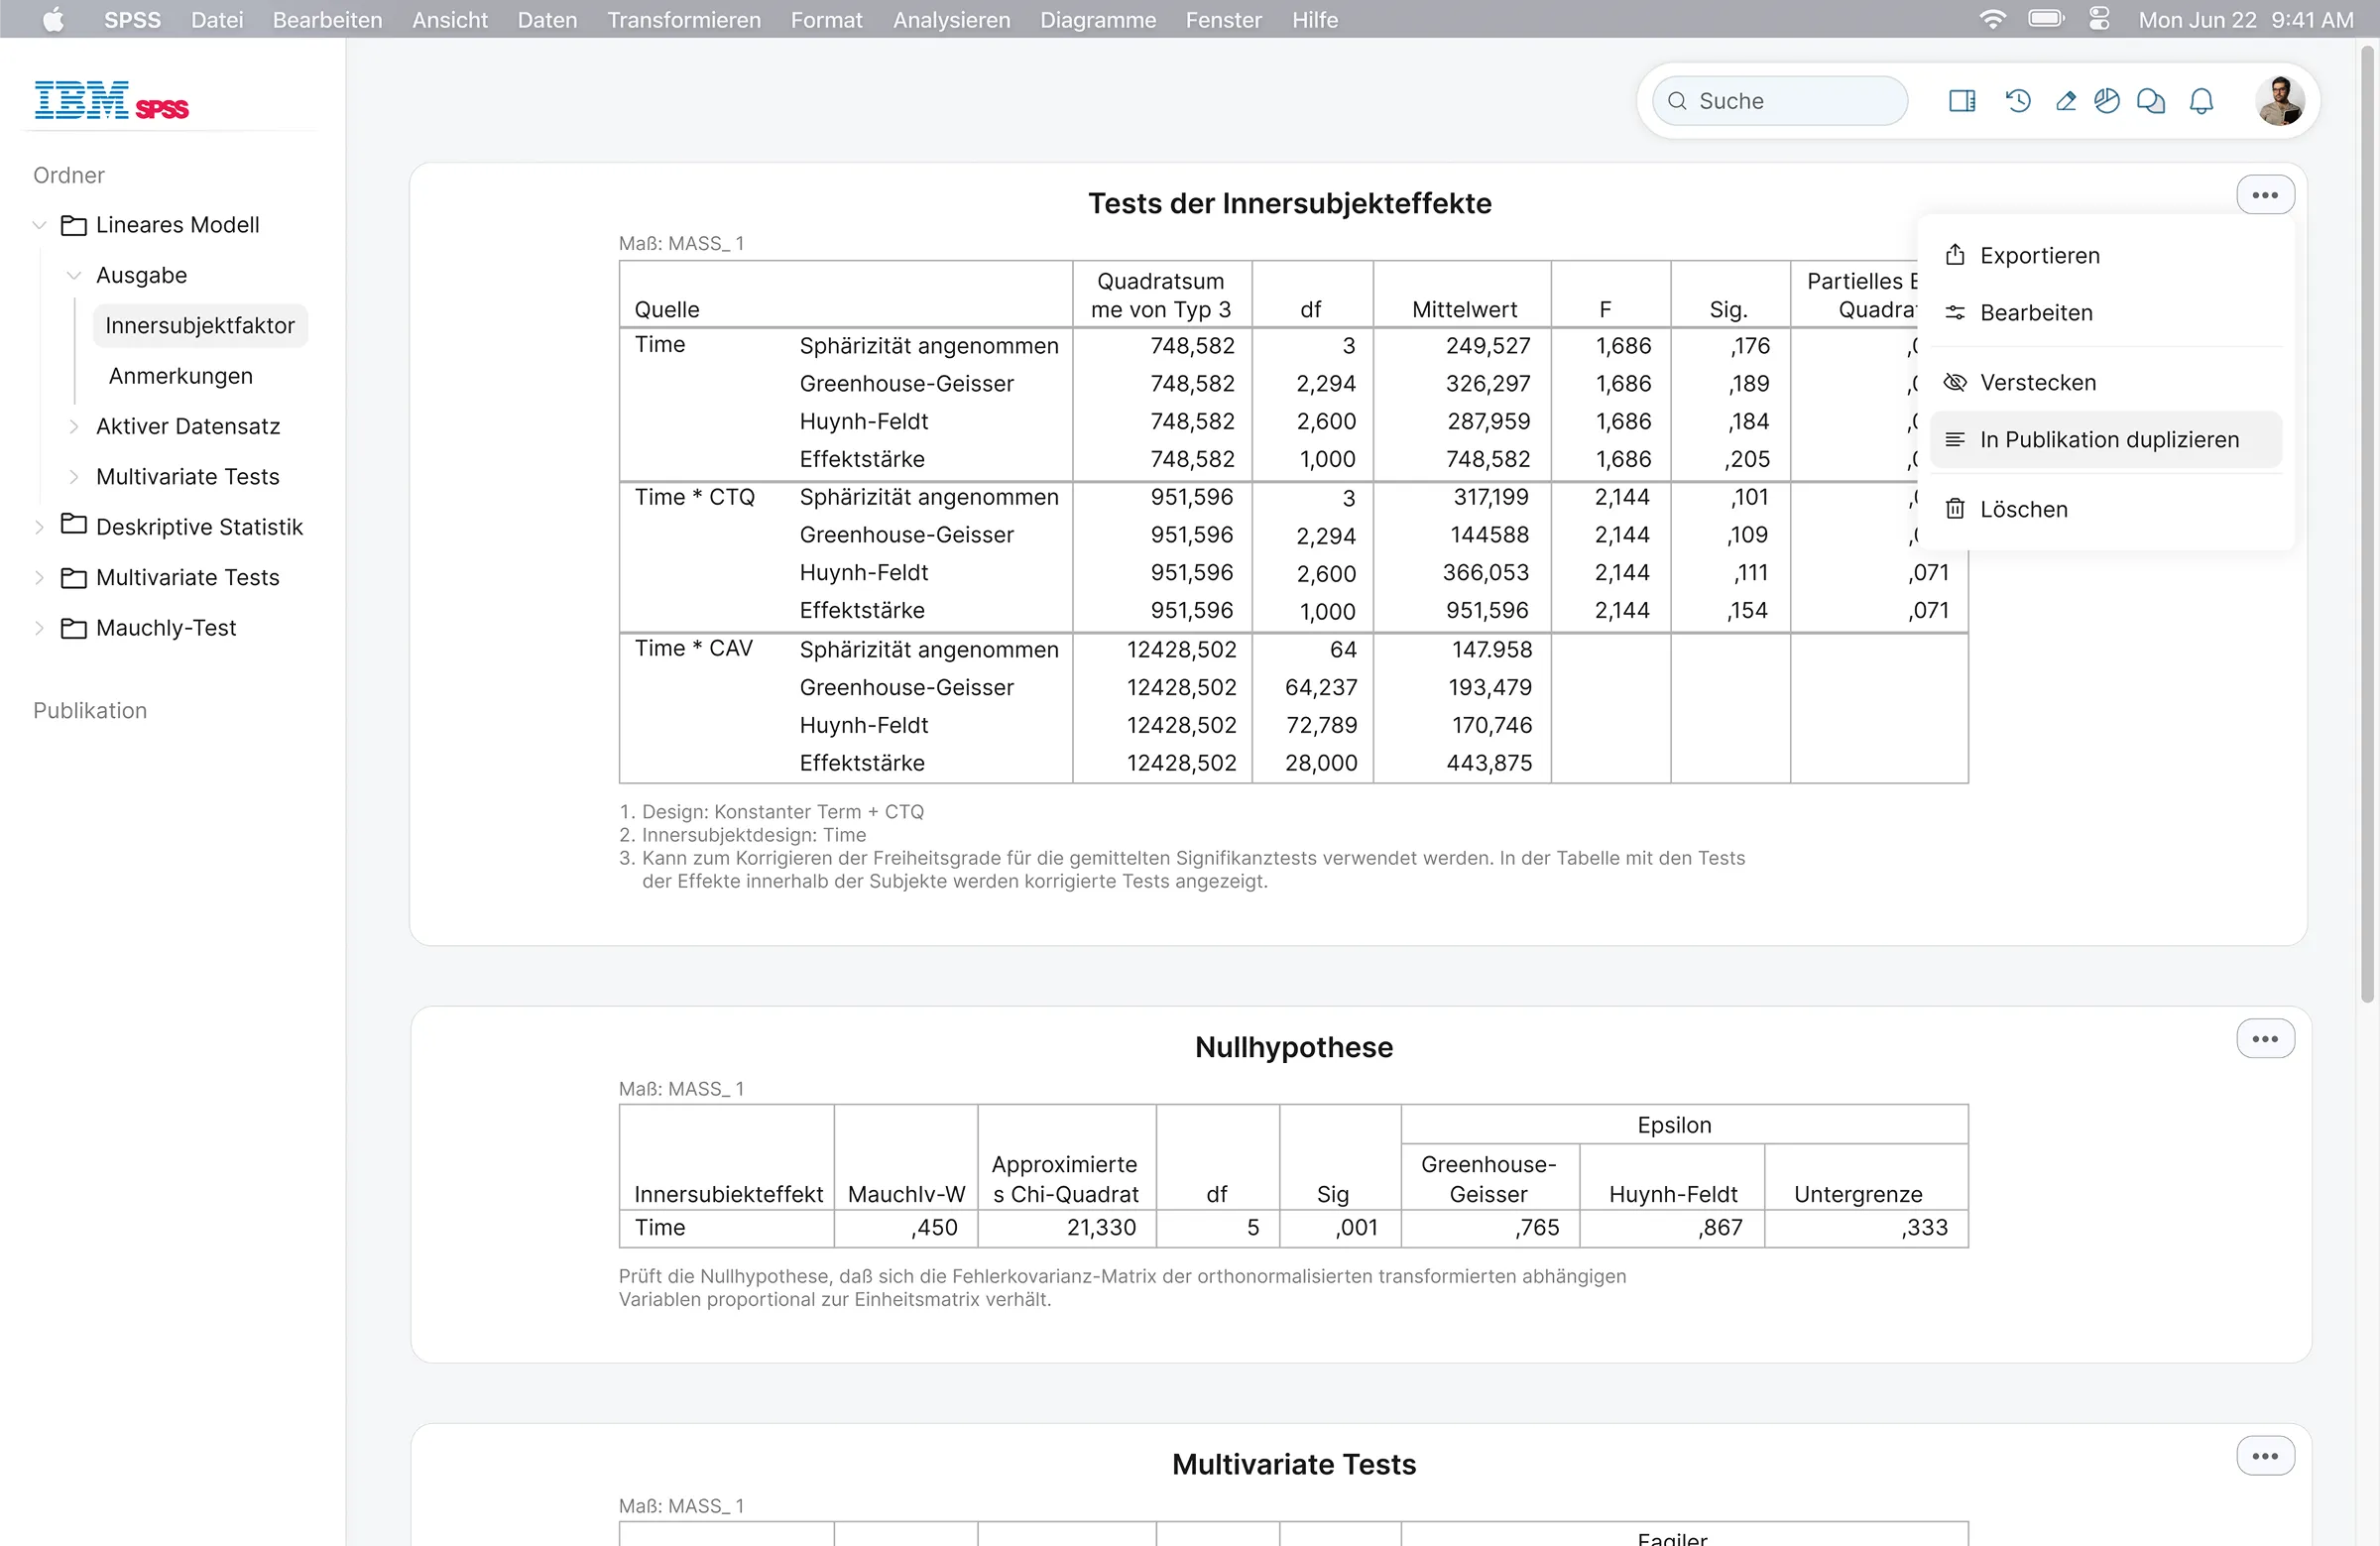
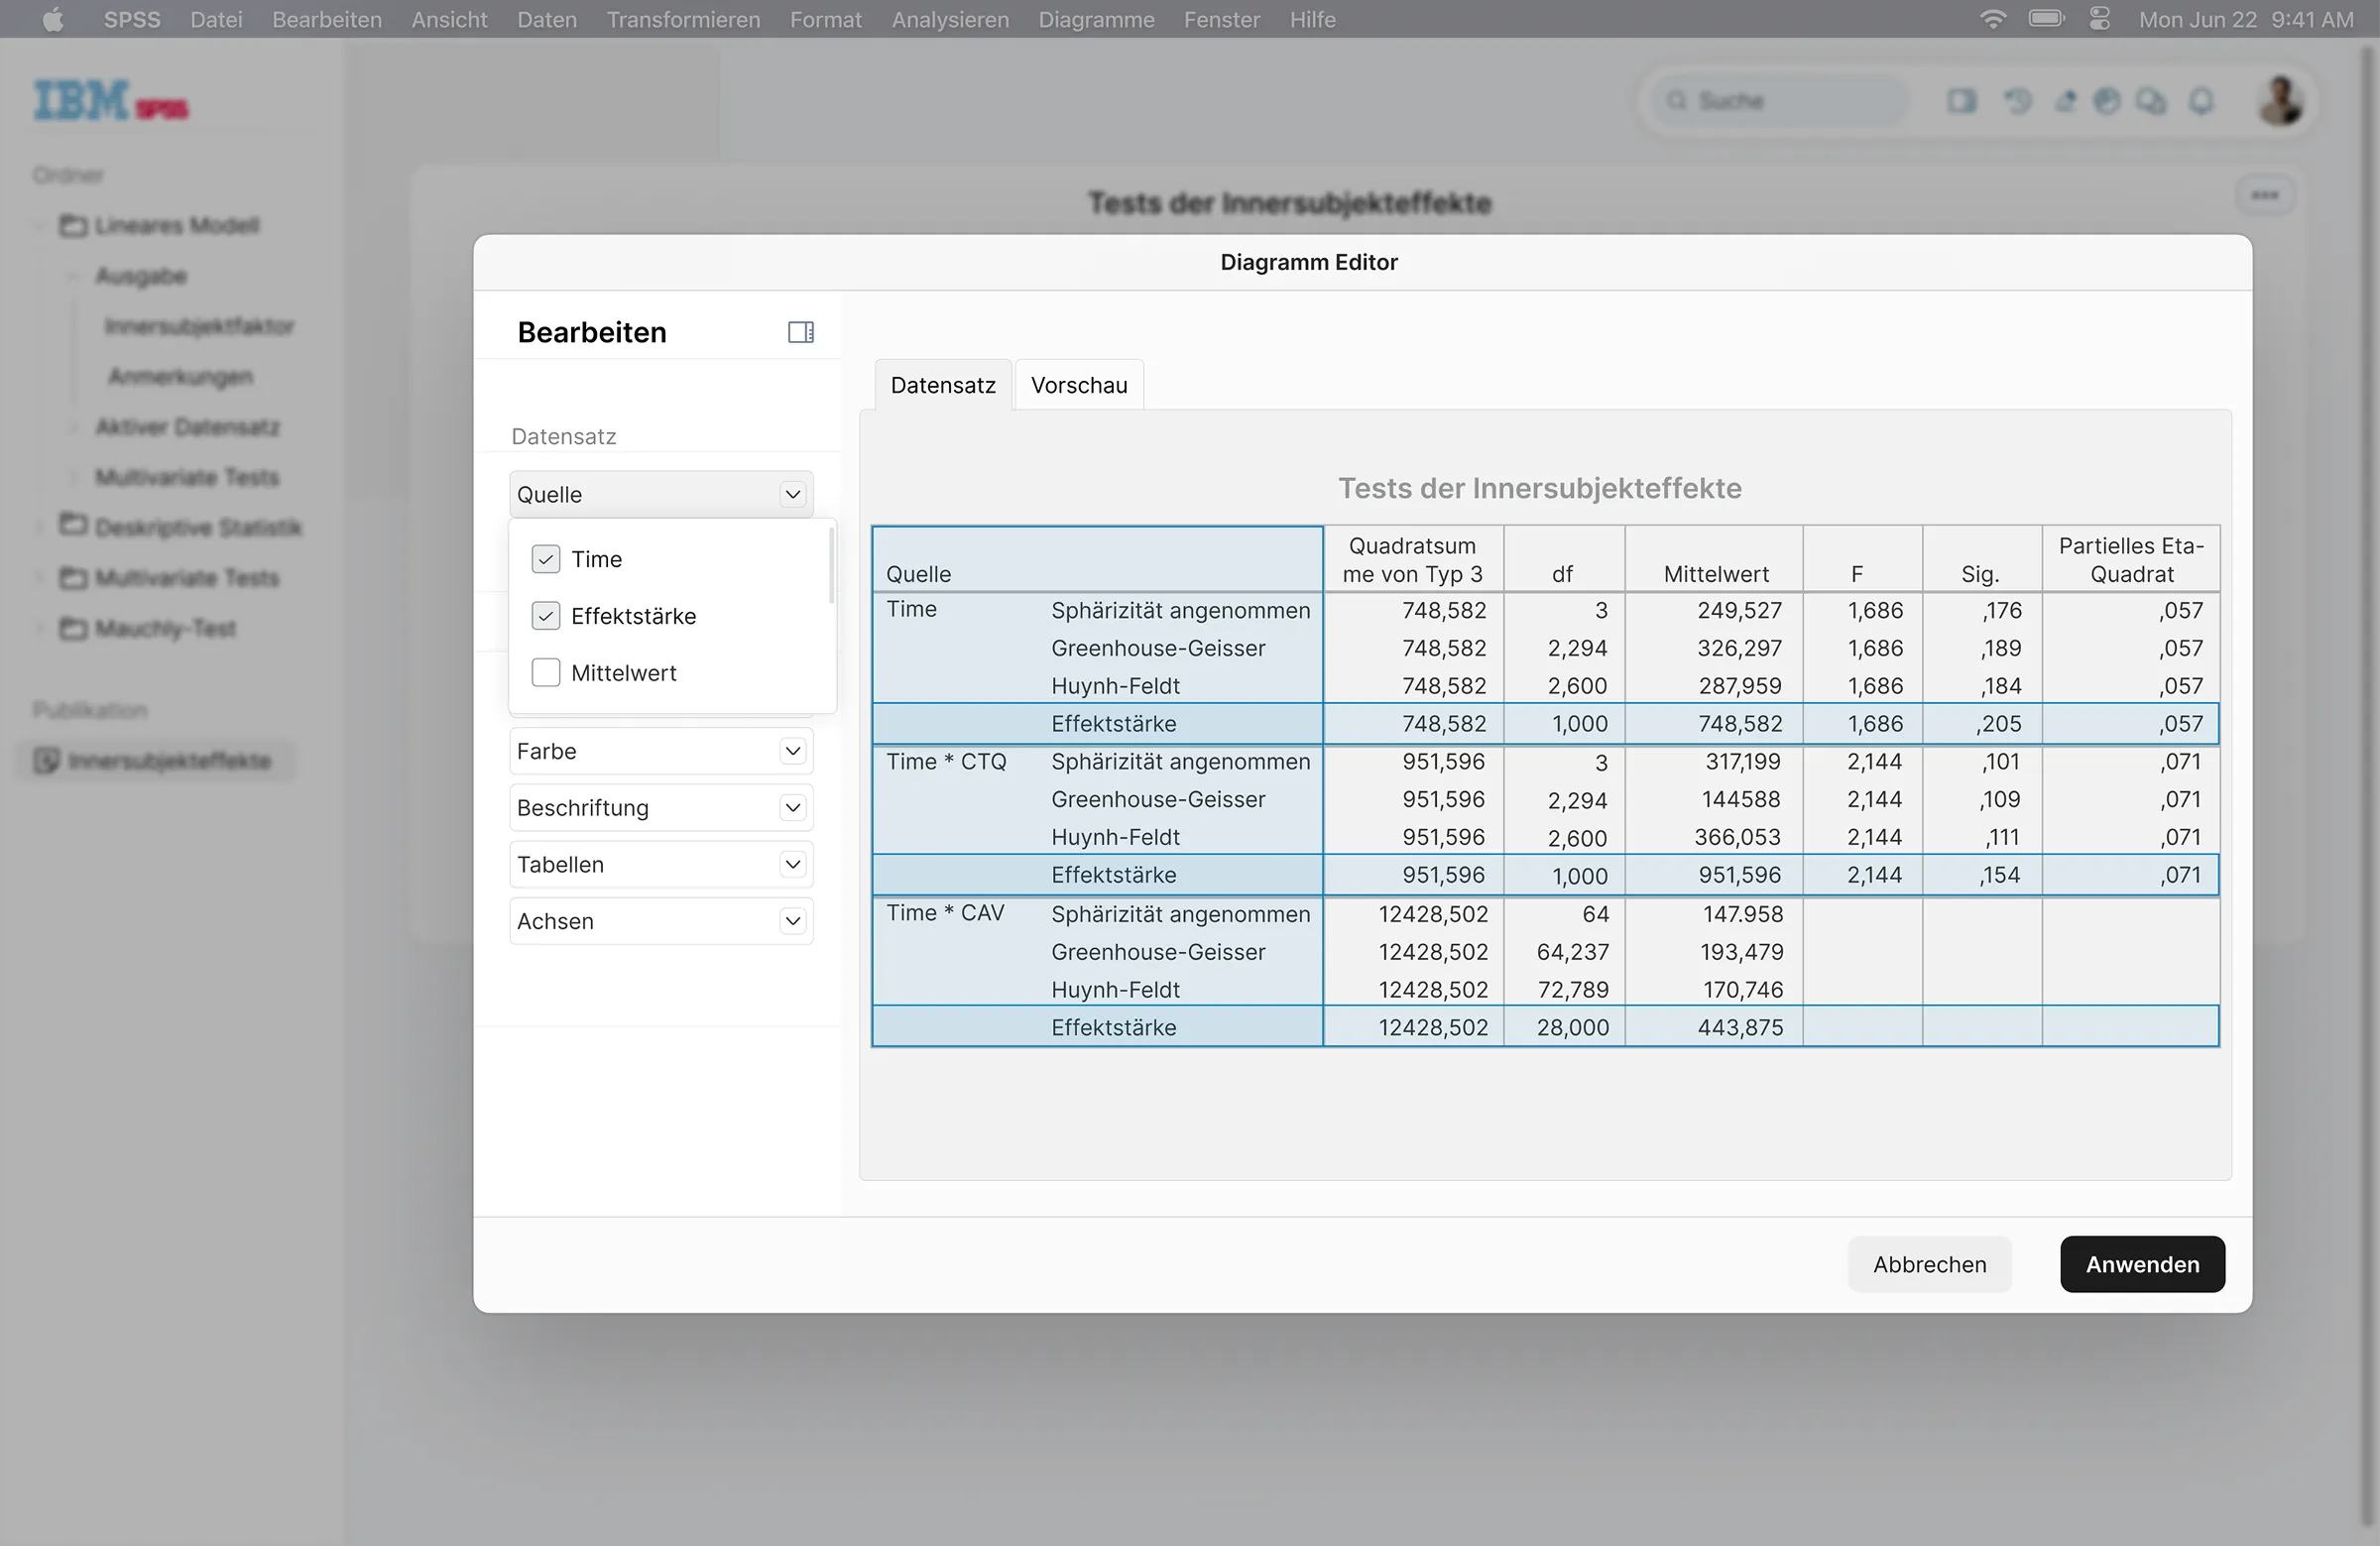
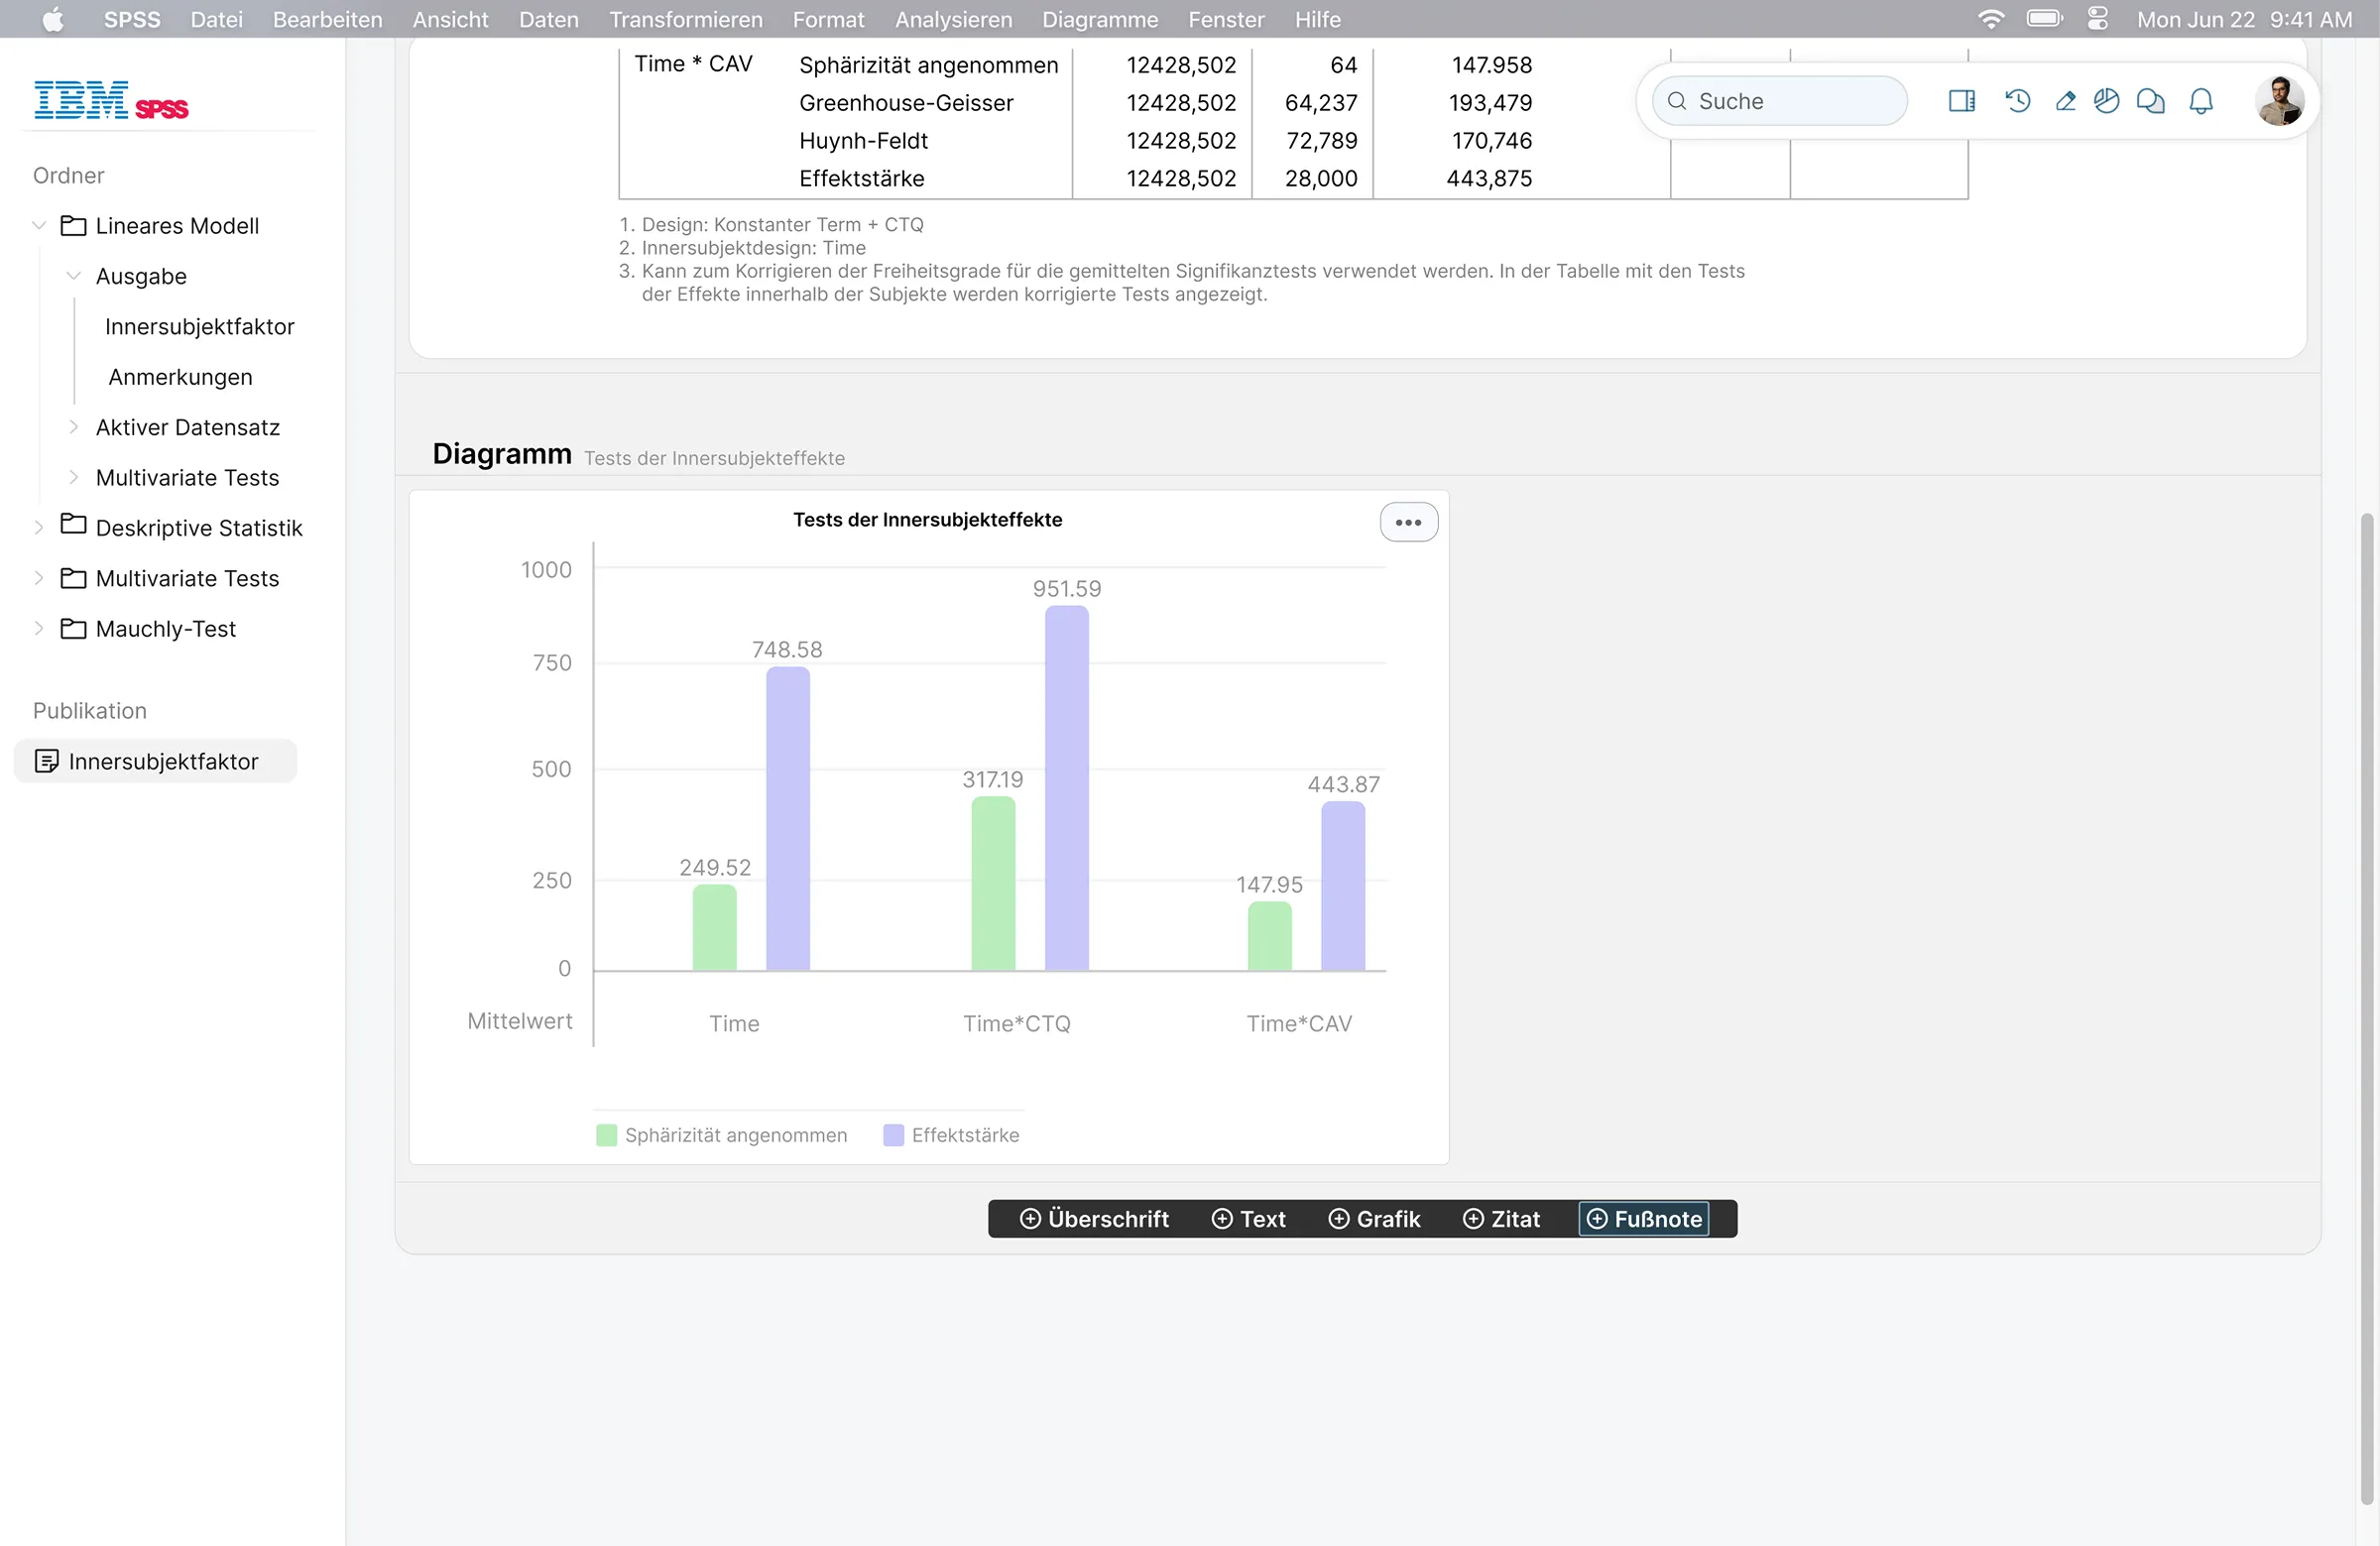
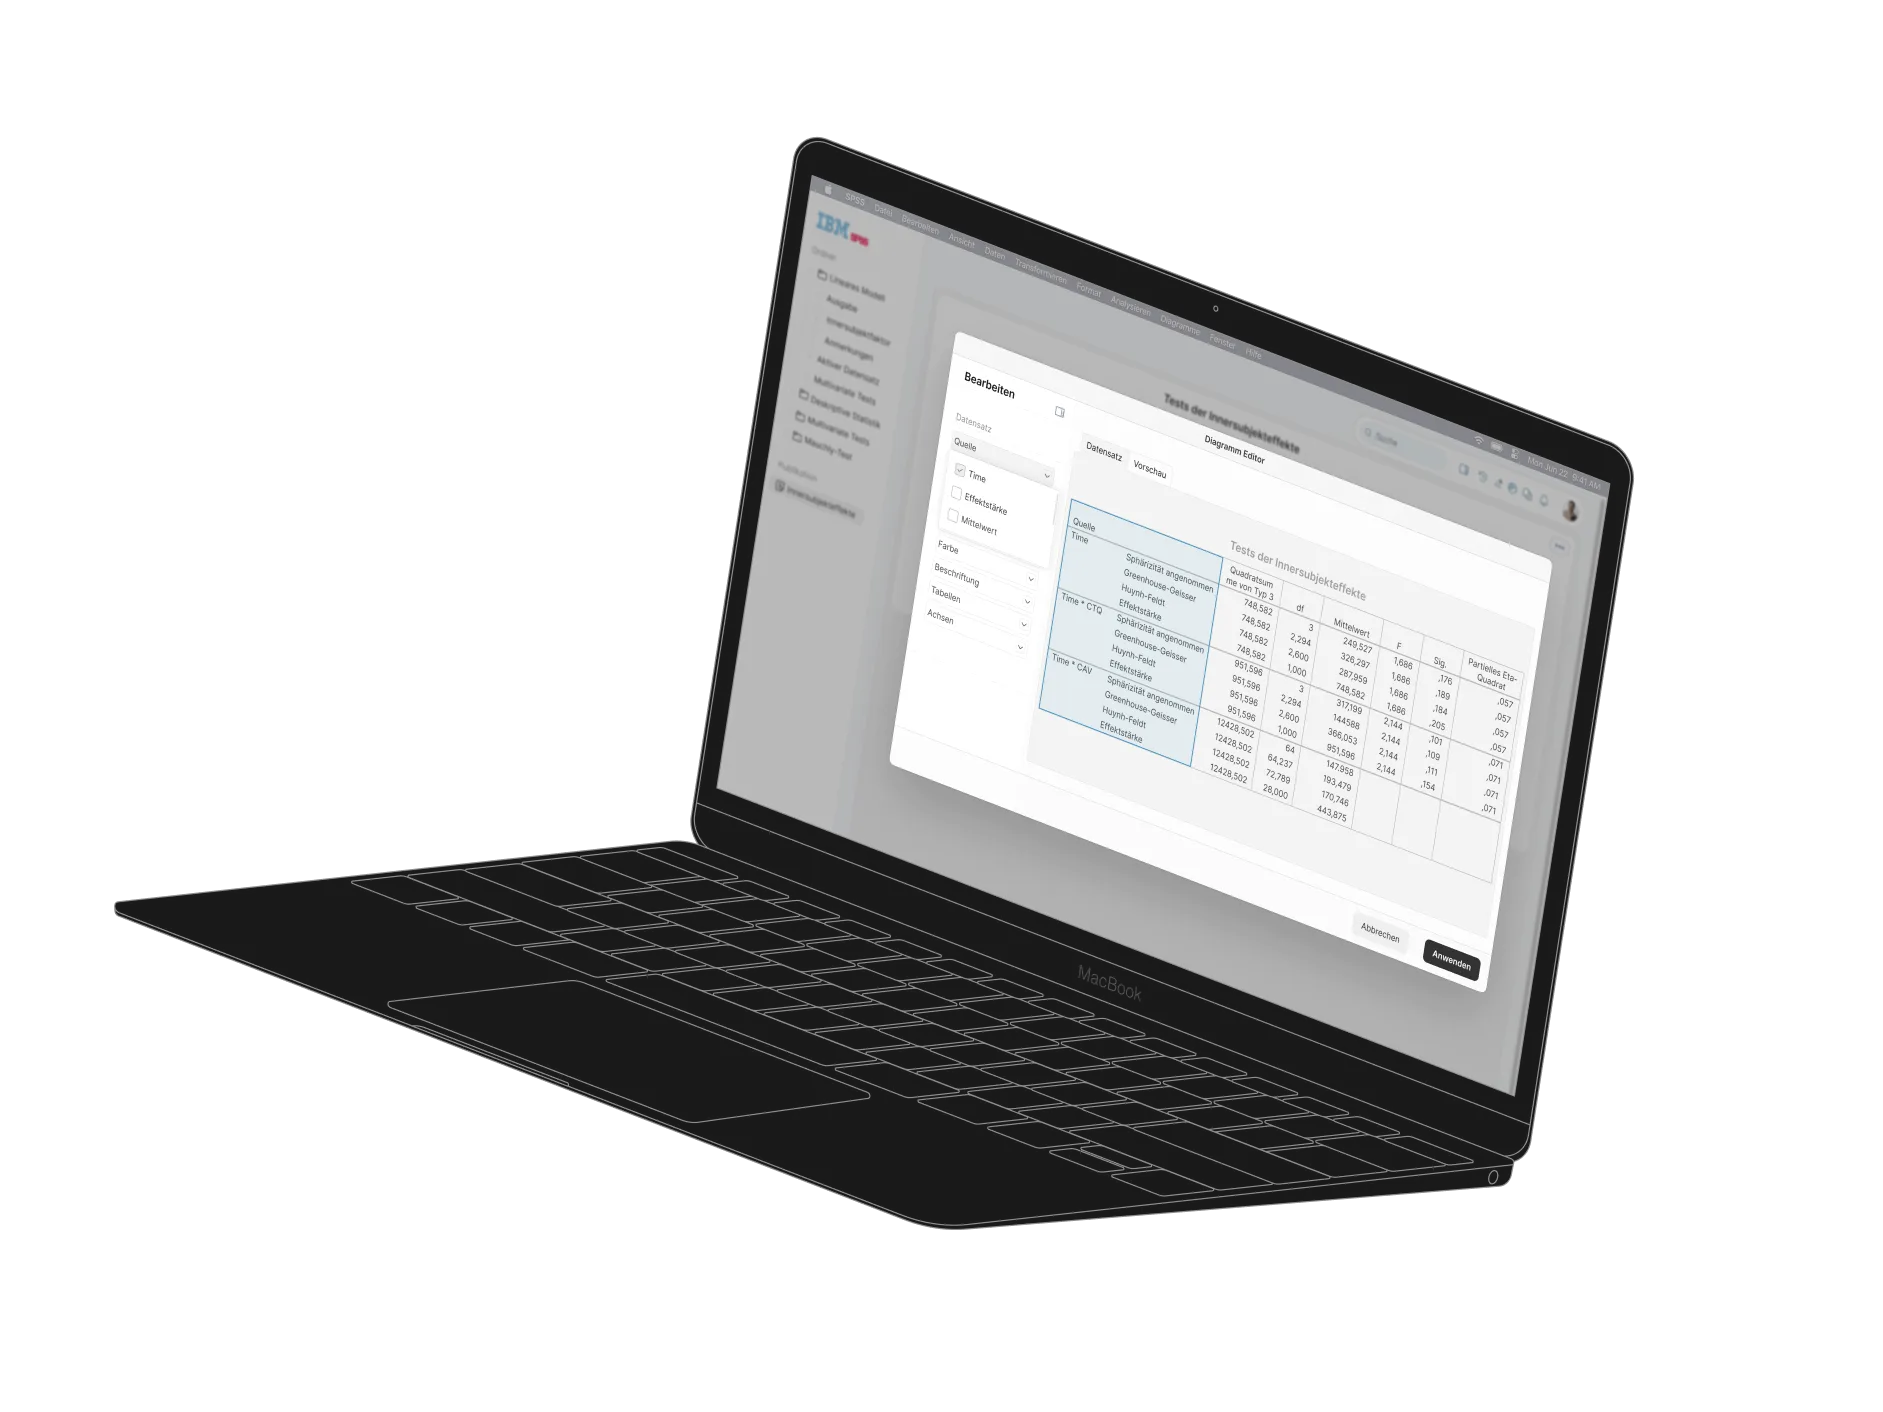
While SPSS remains widely used in quantitative research, its interface structure does not consistently support seamless workflows. Limited control over visual output adds complexity to tasks that demand clarity and precision.
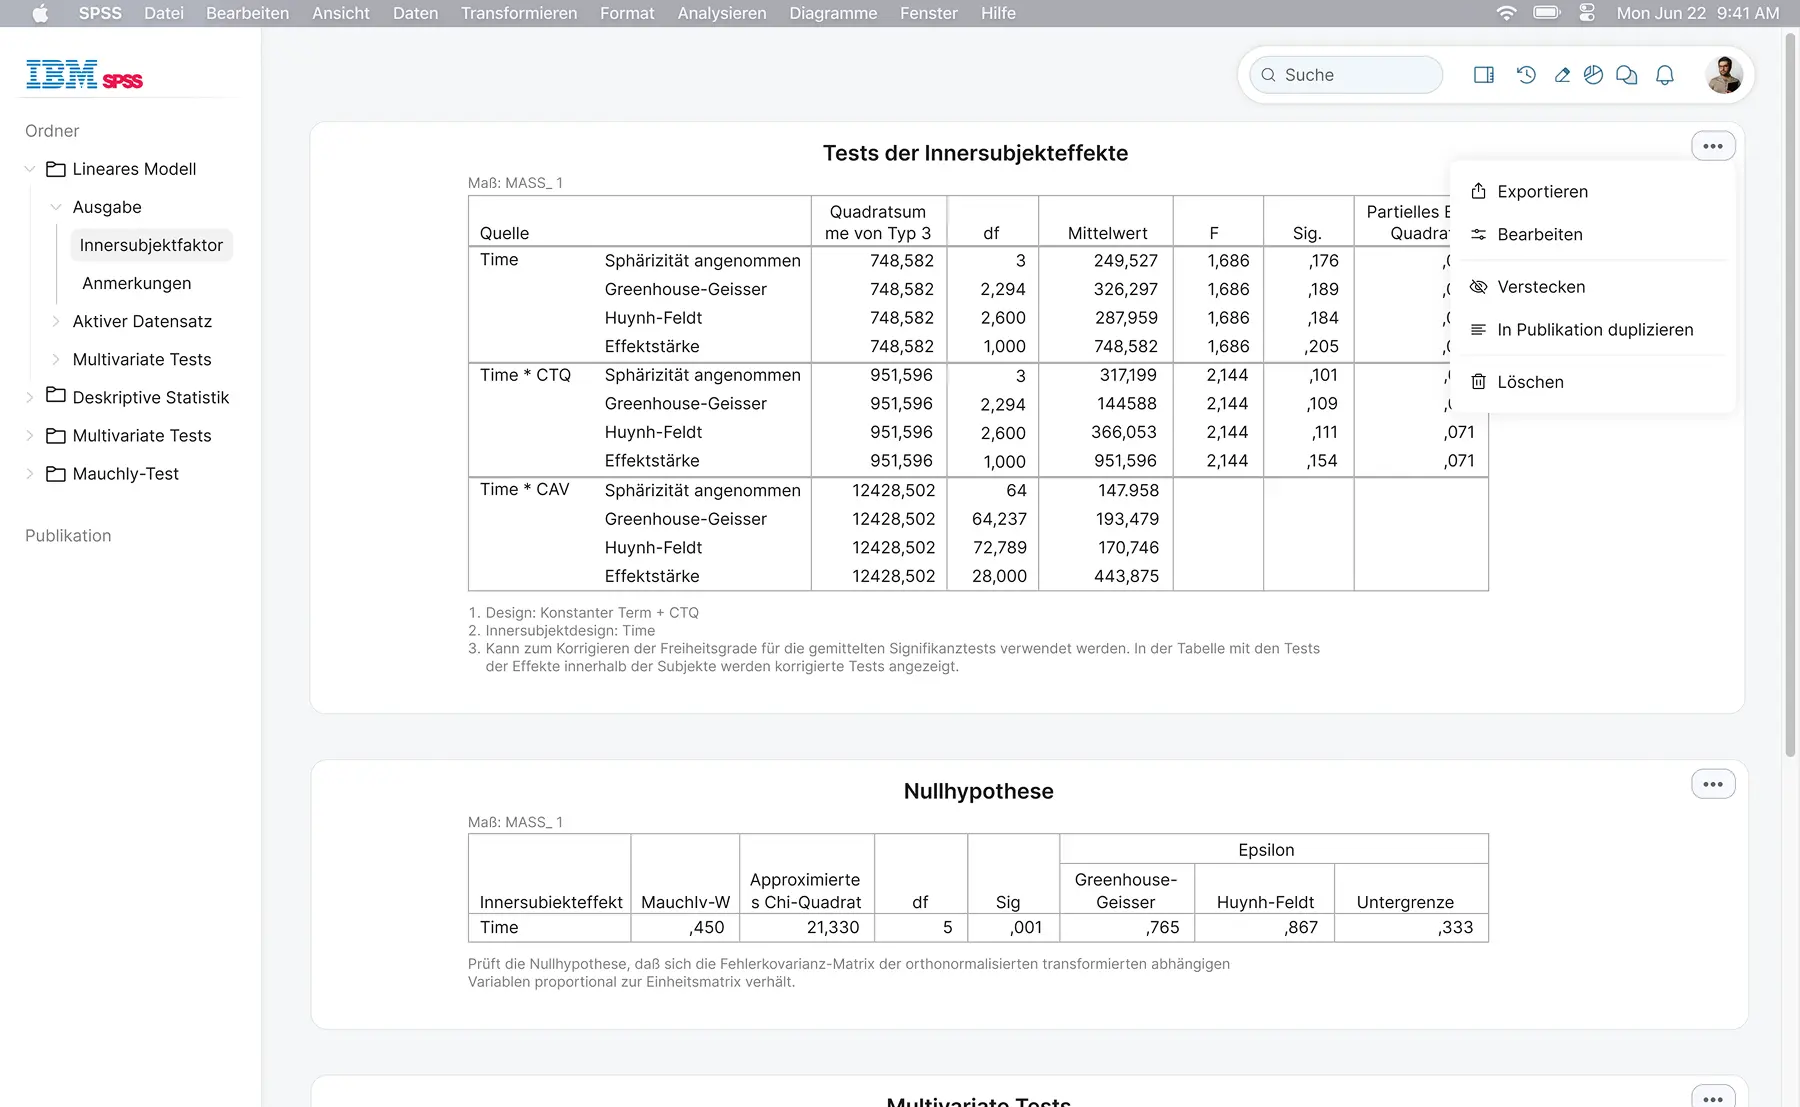
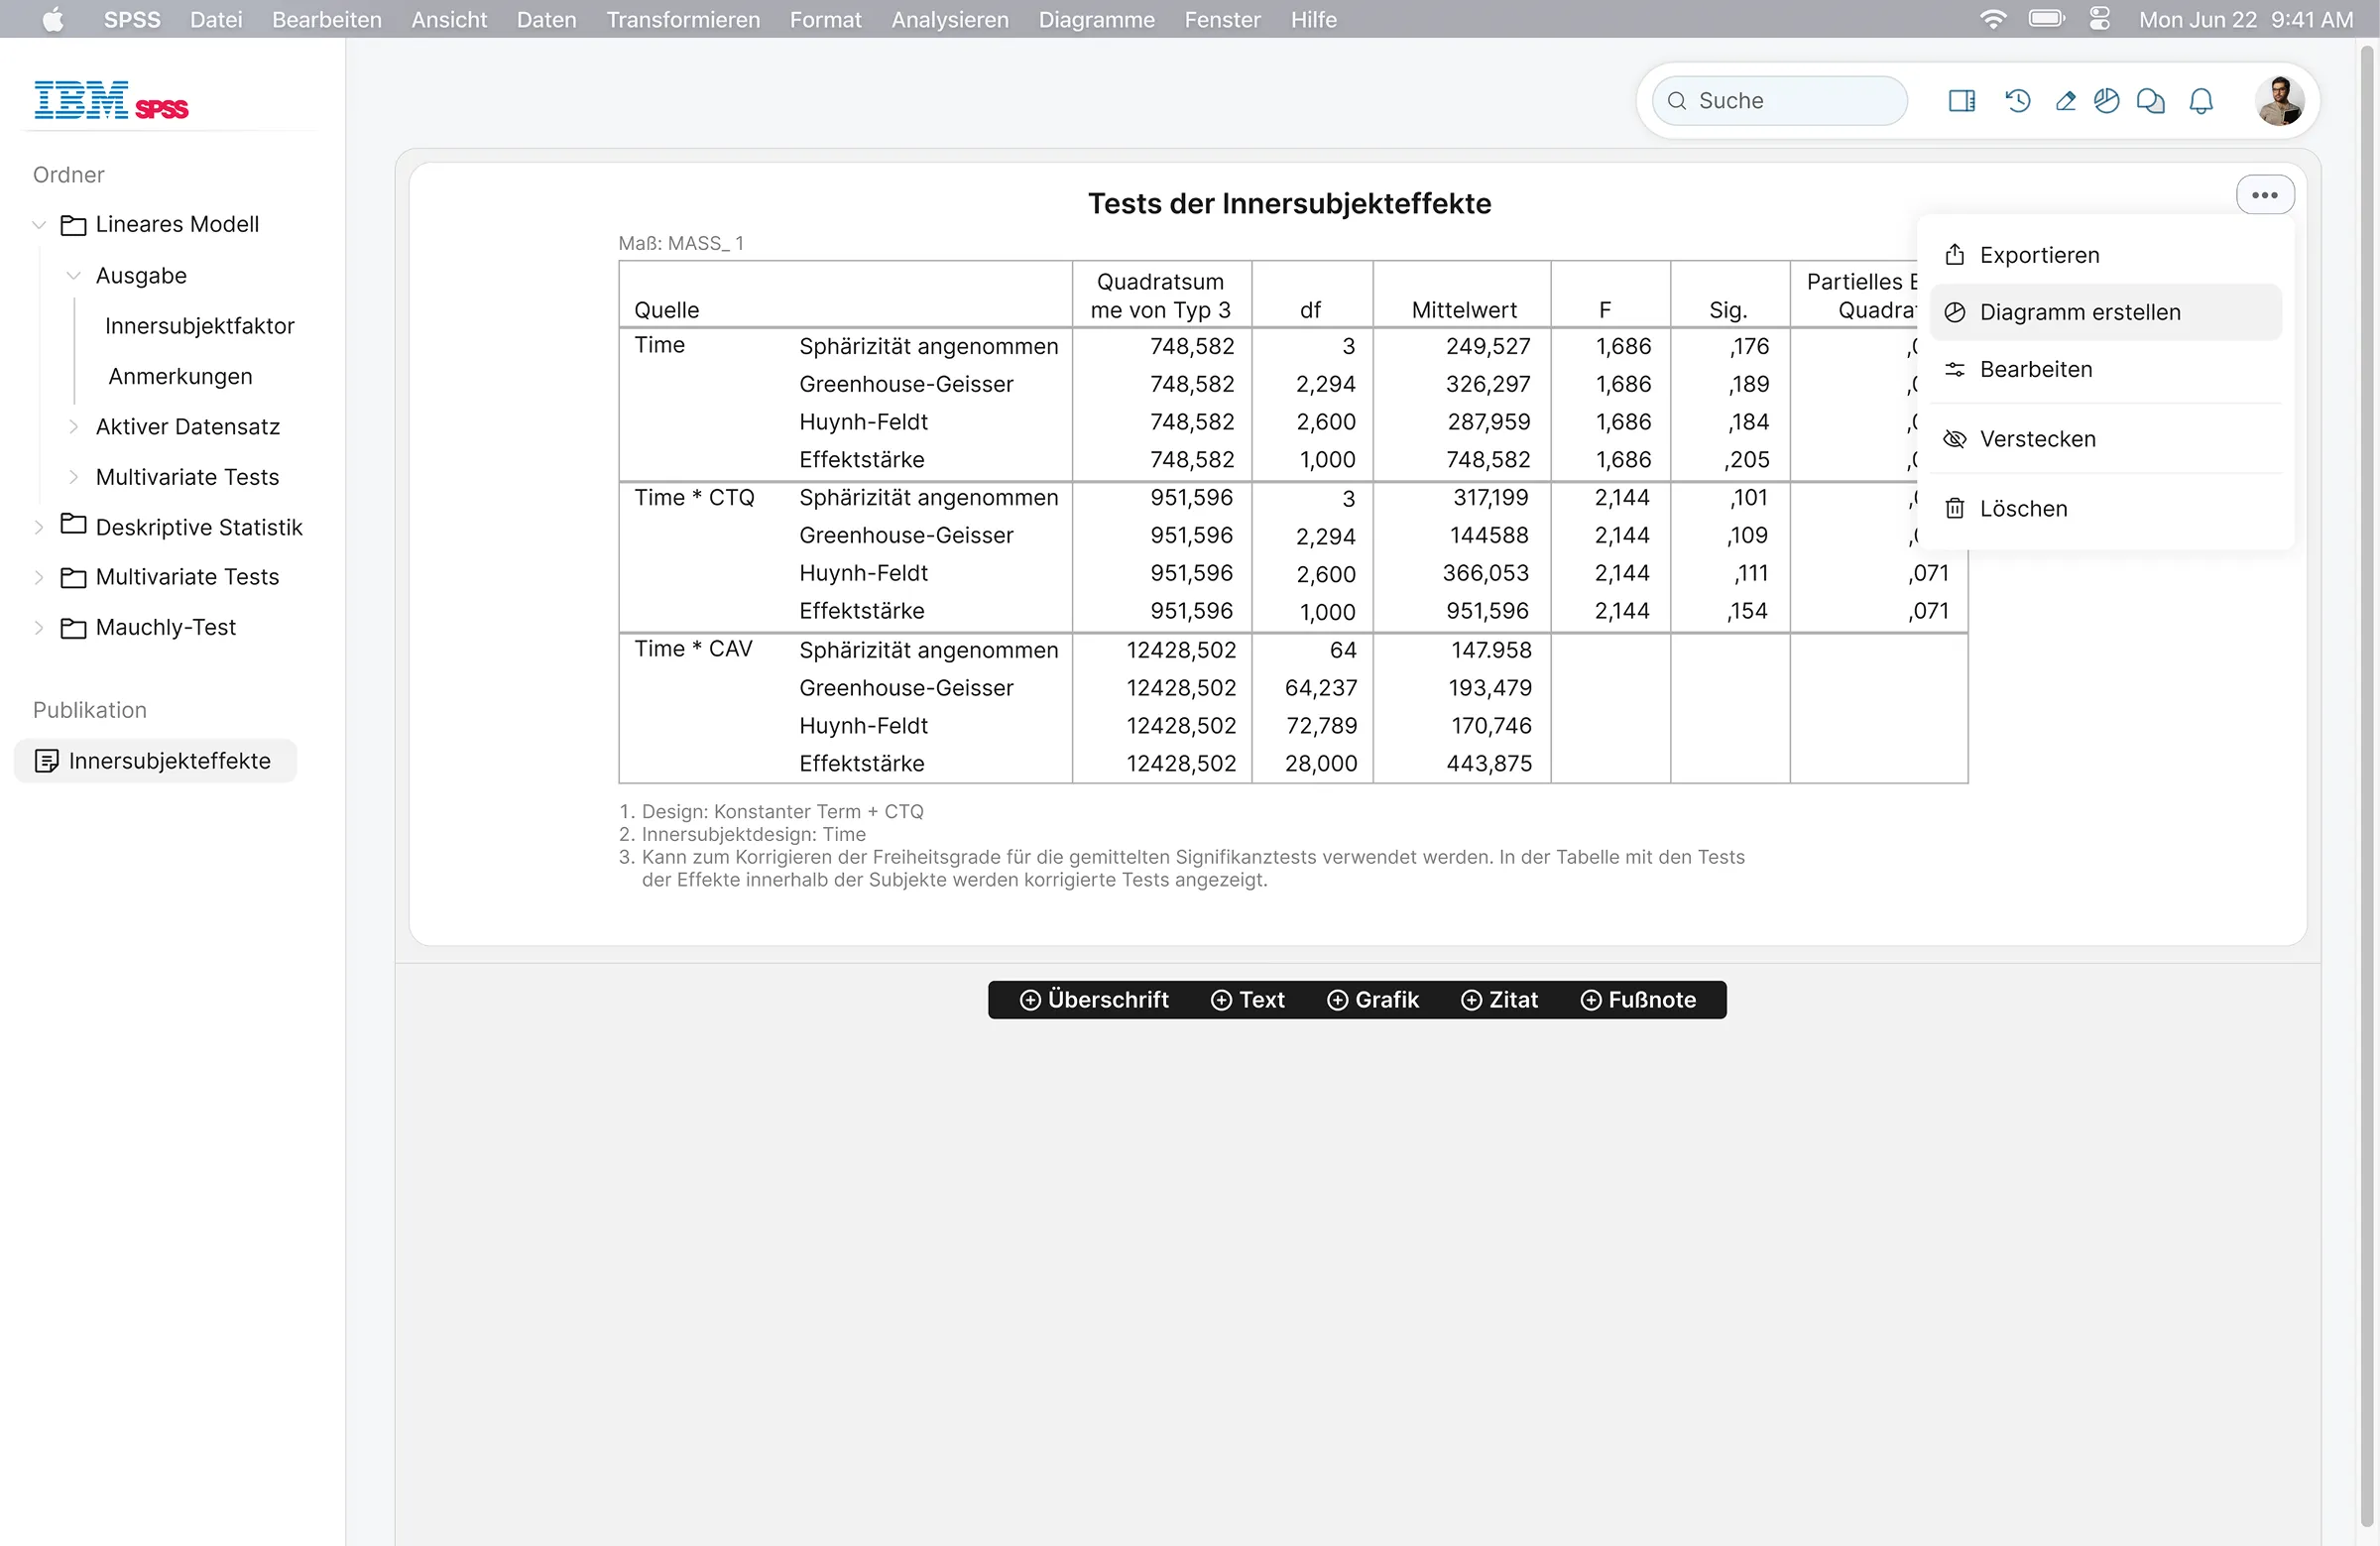
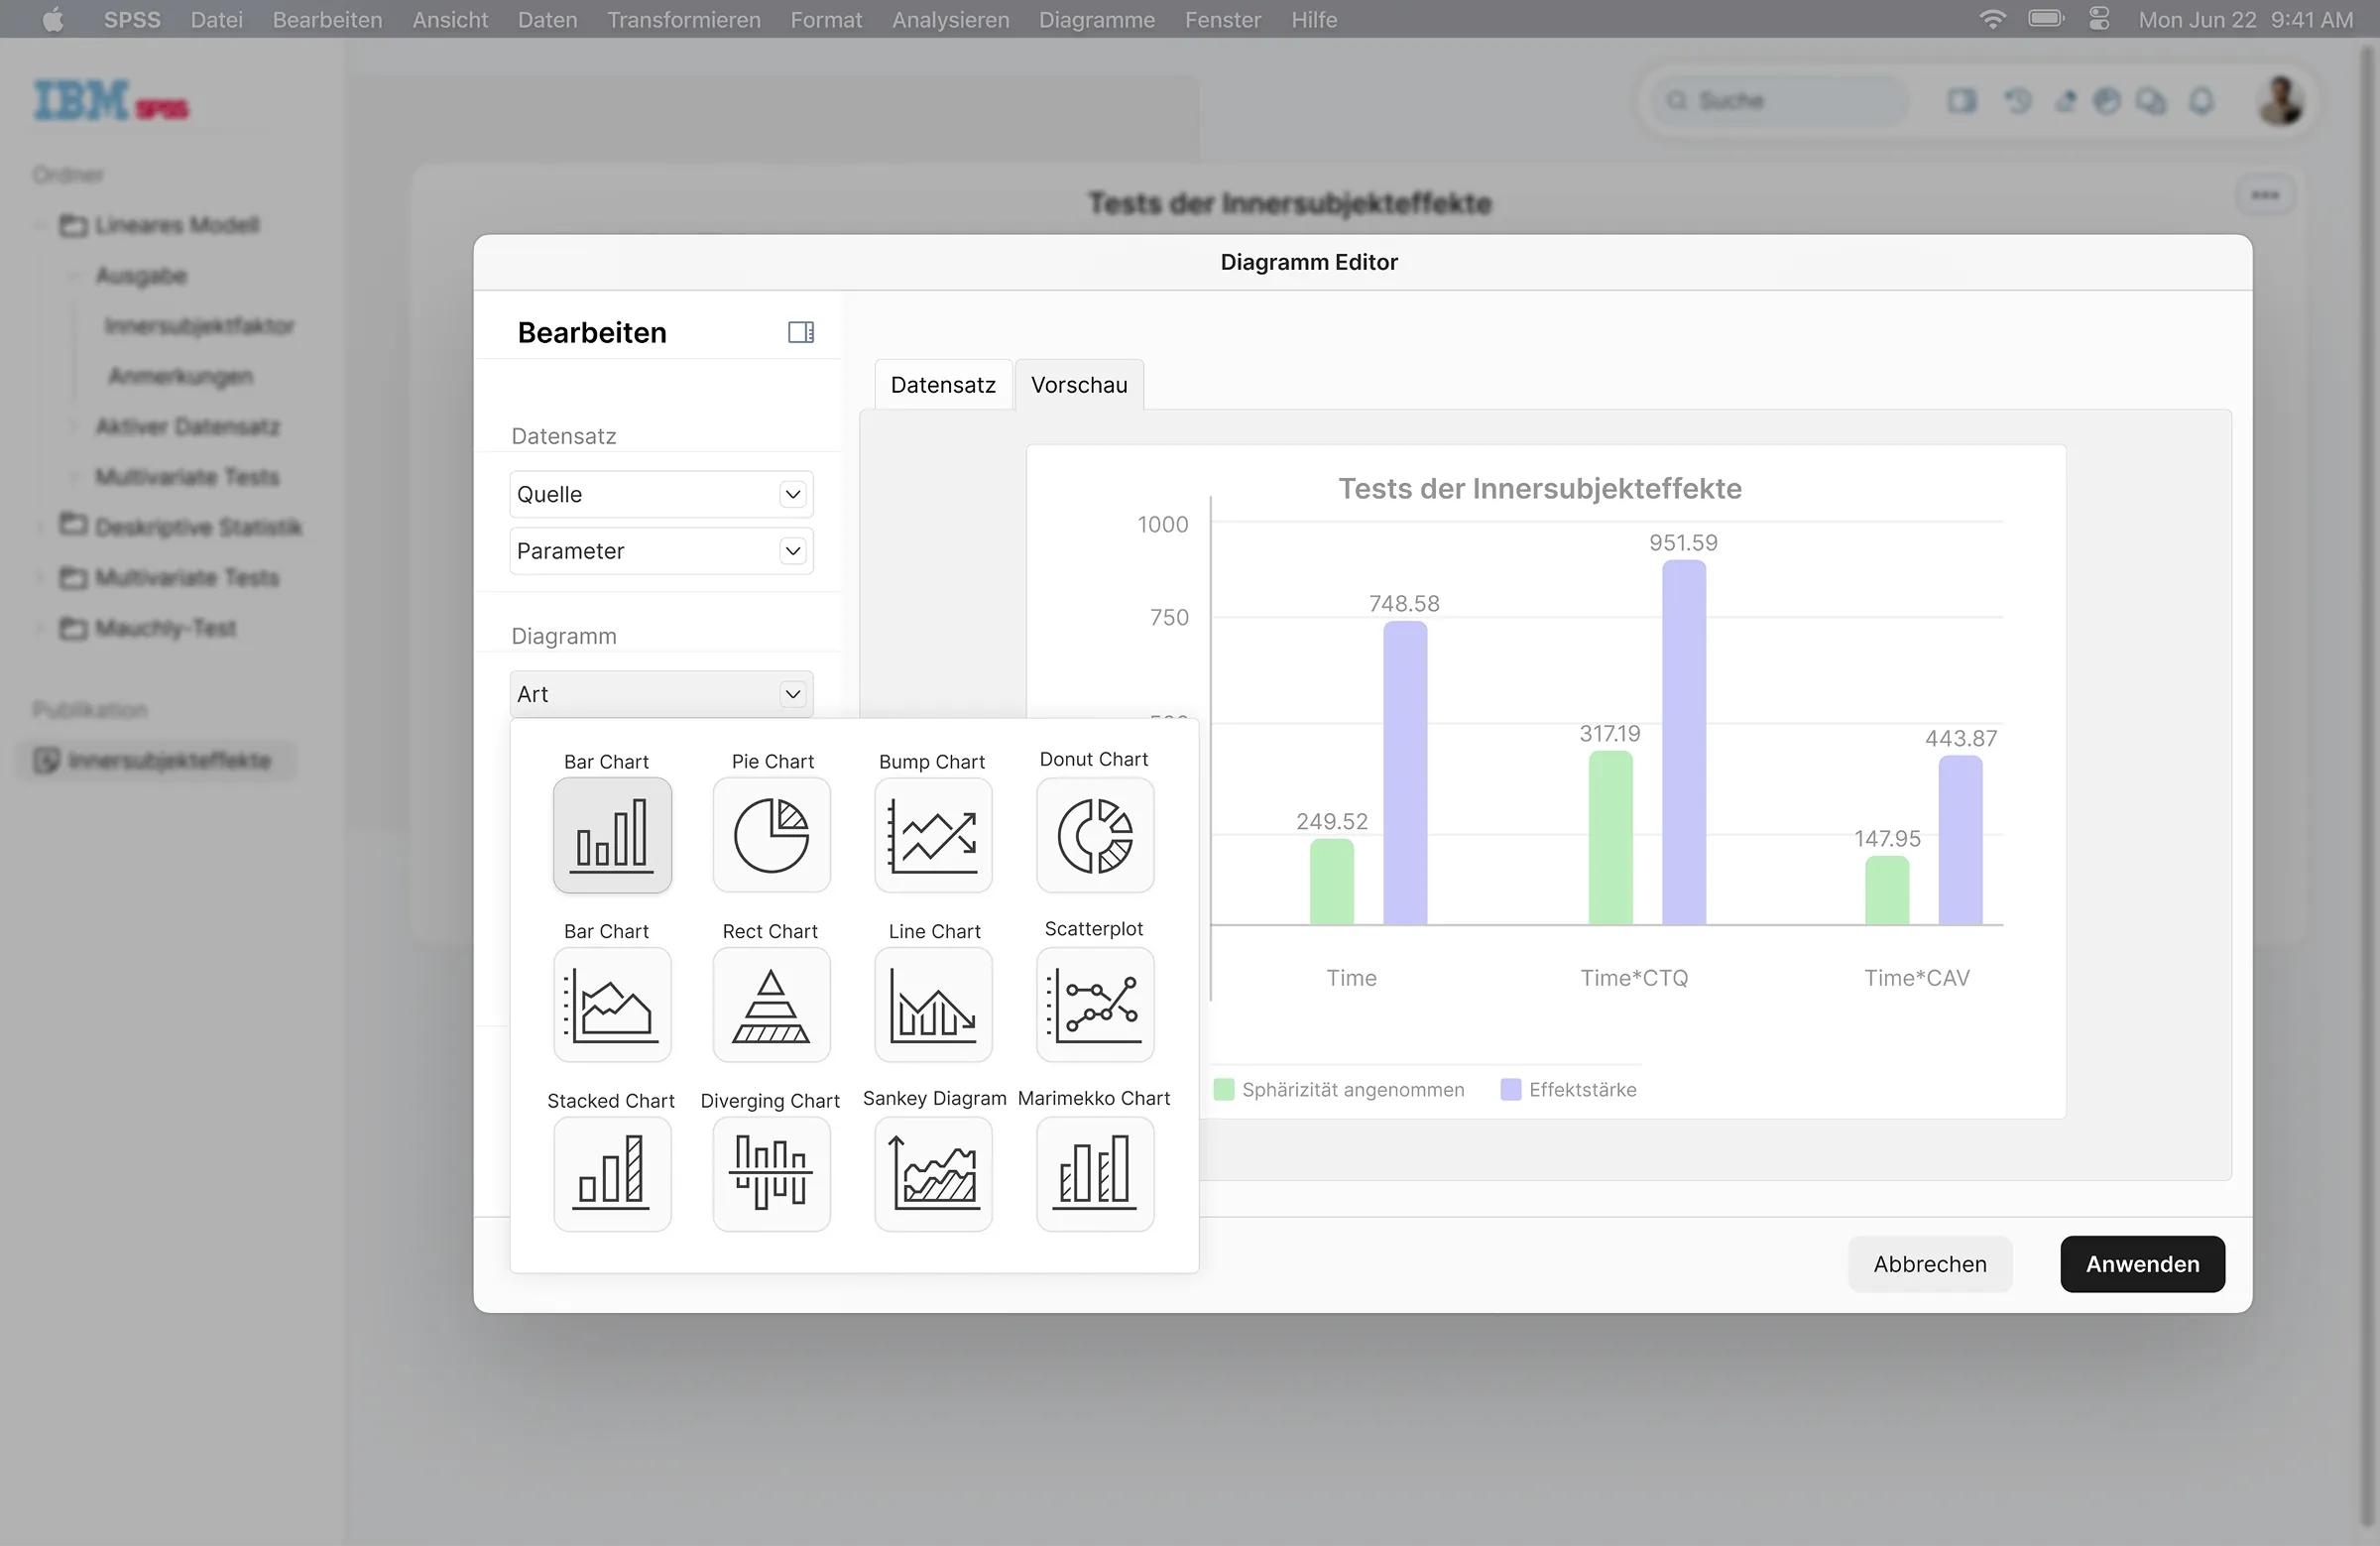
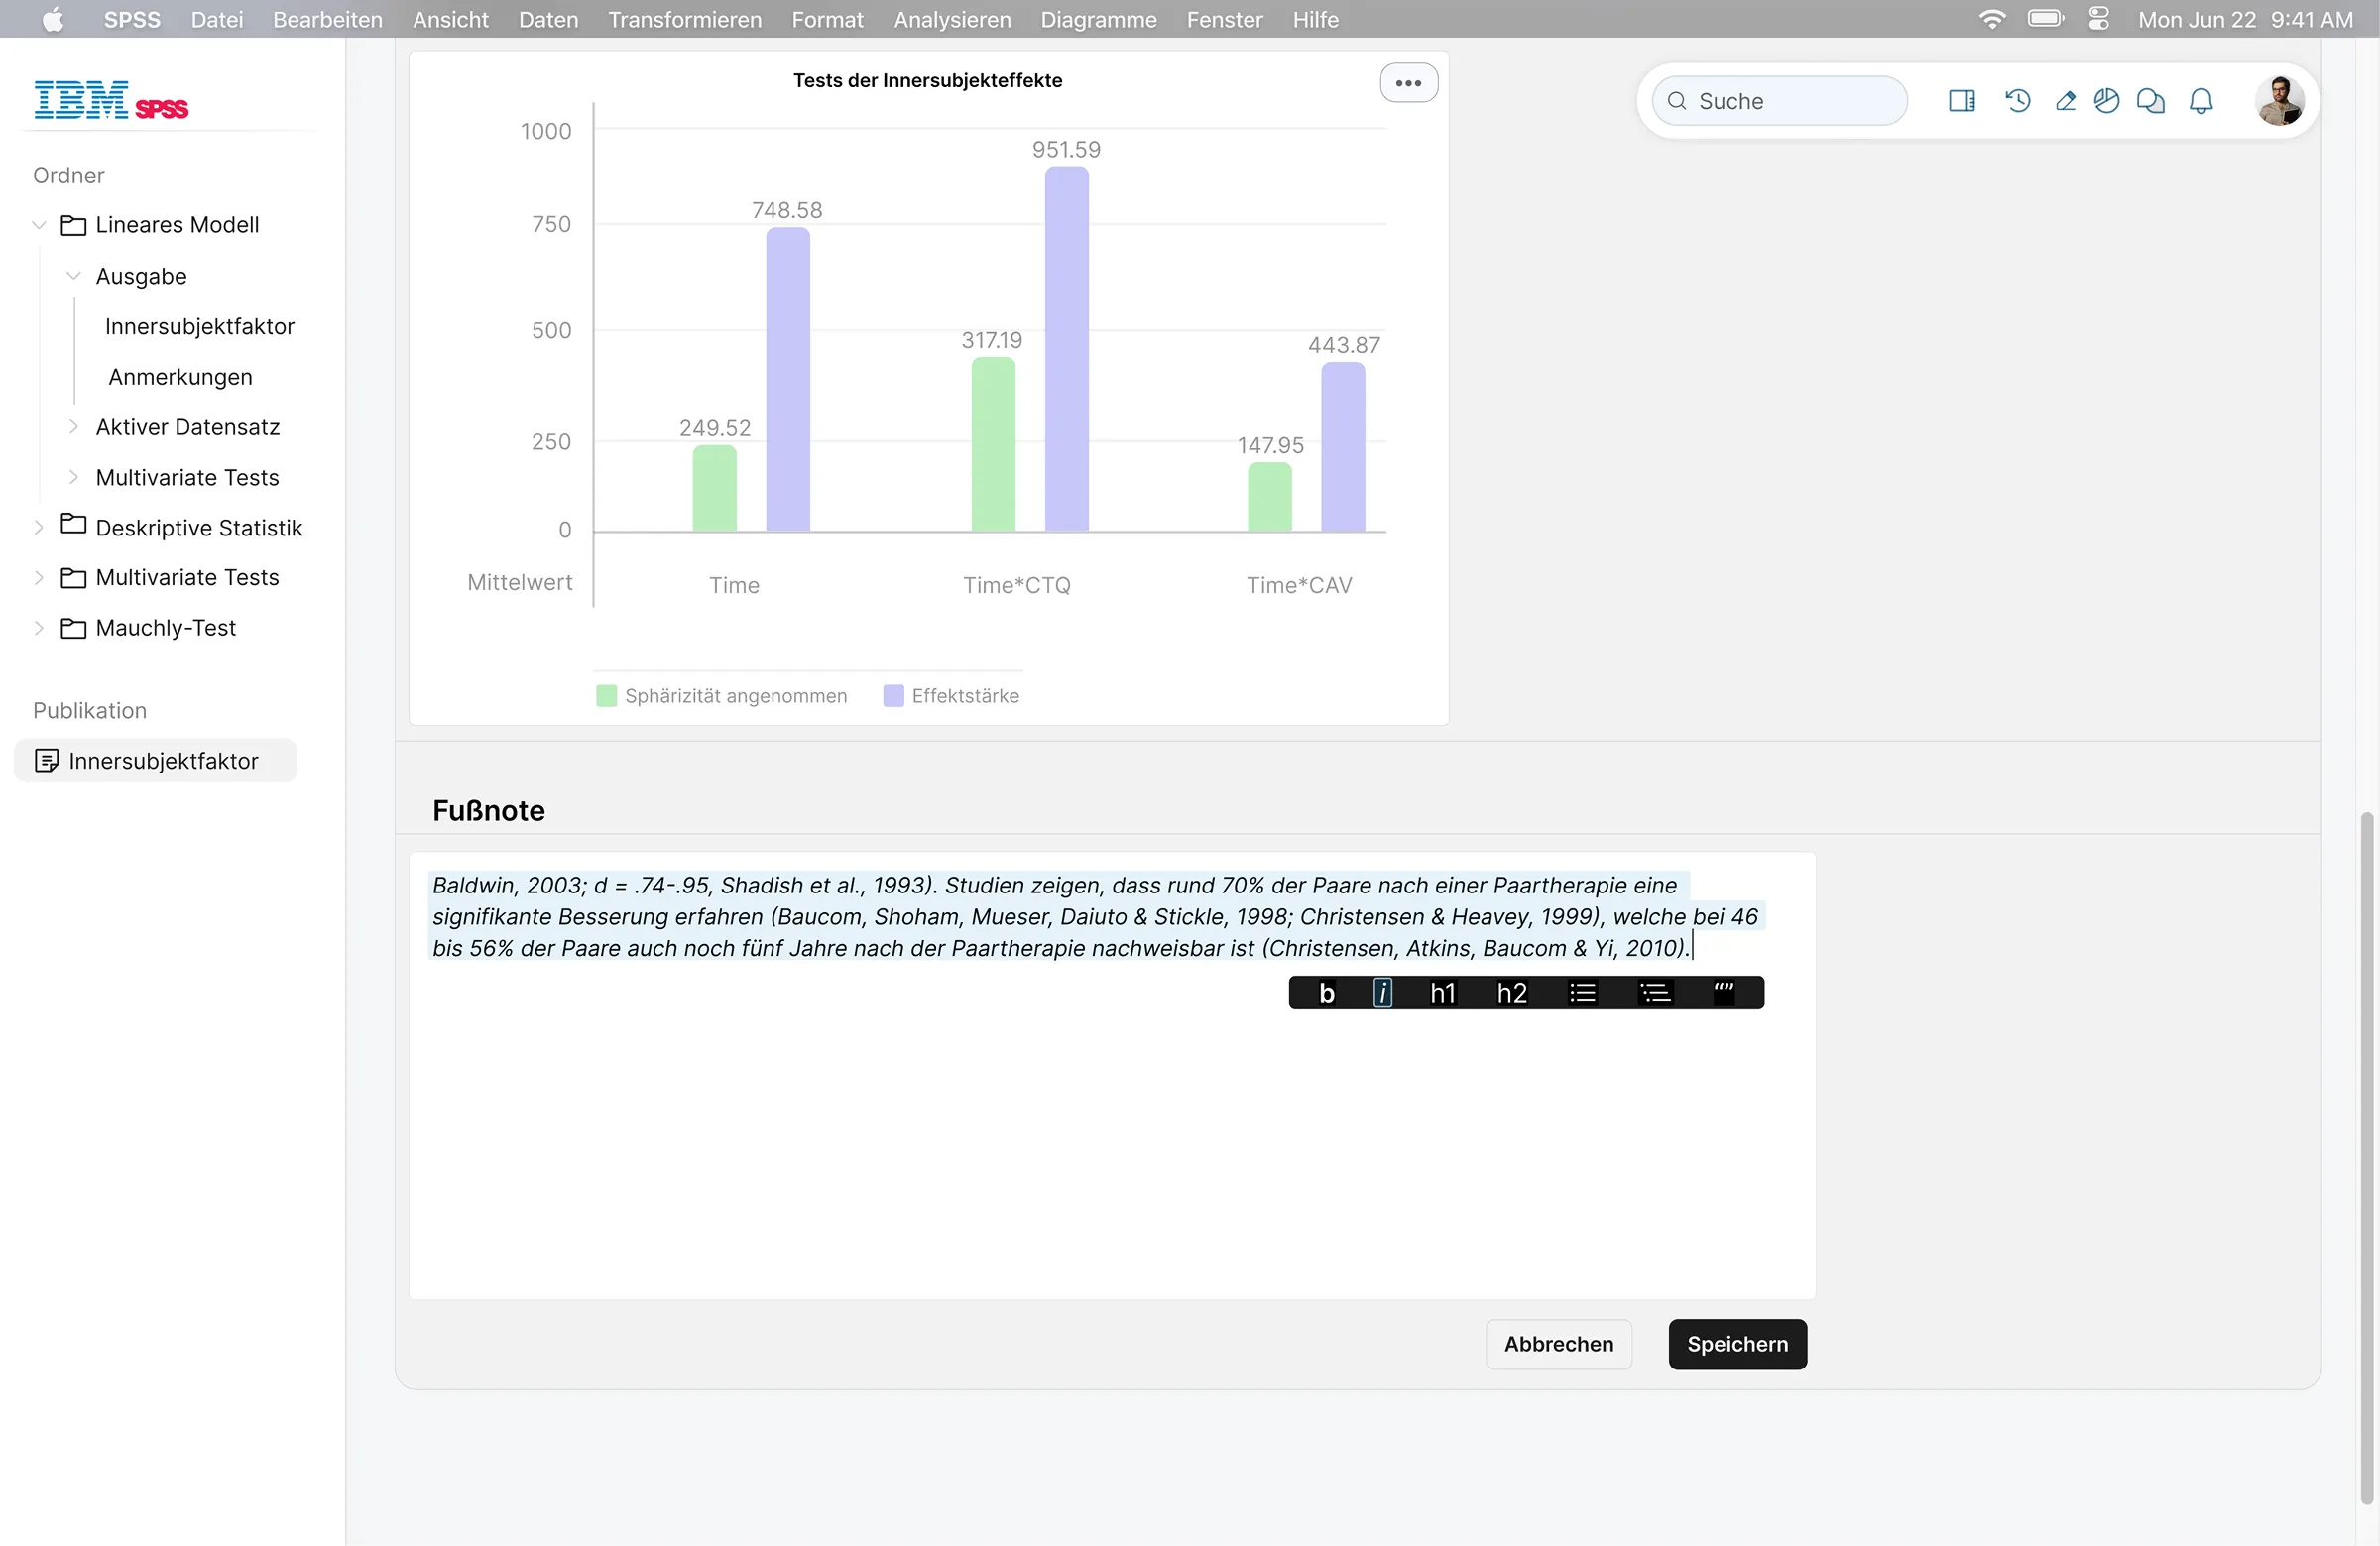
Rather than redesigning cosmetically, the project rethinks how researchers interact with statistical tools, with the aim of streamlining workflows and enabling publication ready outputs within a unified environment.
Role
Design
User journey
Interviews
timeline
November 2023 –
February 2024
team
Kilian Wachowiak
Challenge
Working with statistical software is central to academic research. Most tools focus on computational accuracy while offering limited support for cohesive workflows and presentation quality. Results must be translated into visual representations and formatted according to journal standards, each with its own specifications for layout, typography, figure resolution, and citation style.
This leads to repeated manual adjustments across platforms. Data is exported, reformatted, and reviewed multiple times, shifting time and effort away from research toward formatting requirements.
Approach
The goal was to reduce workflow fragmentation and minimize tool switching between analysis, visualization, and publication. The project therefore explored how these stages could be structurally integrated within a single system.
Research
The project began with an extensive desk research phase to understand typical user flows, interface conventions, and best practices across established statistical tools.
To gain practical insight, I interviewed a psychology researcher who regularly works with SPSS. The conversation revealed concrete user needs and recurring pain points within everyday workflows.
Based on these findings, I developed a user journey mapping a representative research process, which later served as the foundation for the design phase.
Competitor Analyse
I started with a competitive analysis of major data analysis tools, including SPSS, Minitab, RapidMiner, and Google Analytics, examining their interaction models and workflow structures. User feedback and experience reports were also reviewed to identify recurring usability issues.
Expert Interview
To gain deeper insight into real world workflows, I conducted an expert interview with a psychology professor specializing in couples therapy who regularly uses SPSS to analyze empirical research data.
“Can you give me an insight into your daily work with SPSS? How do you use the tool, and can you walk me through a typical workflow step by step?
— Prompt given to the participant
The 45 minute session included a live demonstration of his typical SPSS workflow, followed by a structured discussion of recurring pain points and potential areas for improvement. His workflow includes importing session data, conducting statistical analyses, interpreting results, and preparing findings for publication in order to secure continued research funding.
User Journey
As the interview was conducted via Zoom and recorded, the material could be reviewed and analyzed in detail. From this evaluation, a representative user scenario was derived and translated into a user journey.
The scenario follows a researcher who aims to create a dataset and analyze it. The journey maps the required steps toward this outcome, highlighting friction points and identifying potential areas for improvement.
*Looking back, I would not include emotional indicators in the journey. Representing emotional states through visual markers relies more on personal interpretation rather than observable evidence.
Key Findings
The interview and desk research generated several key insights:
  • Researchers often switch between multiple tools for there workflow
  • Participant exports numbers from SPSS, create visuals in Illustrator, and finalize presentations in PowerPoint.
  • Presentation and publiaction plays an essential role in the work of researchers.
  • Preparing data in a visually appealing way is a crucial part of communicating research results.
  • There is a high level of pressure to publish, as continued research funding often depends on it.
  • Each publisher has slightly different guidelines for layout, typography, formatting etc.
  • Researchers often submit their papers to multiple publishers, adapting the same data repeatedly to different sets of rules.
After analysing the collected insights, I documented all findings and clustered them into distinct opportunity areas. These were then evaluated based on desirability and viability.
As the core analytical functions of SPSS were generally perceived as sufficient, the most promising areas for improvement were publication workflows, data visualization, and the reduction of unnecessary tool switching.
Interface Comparison
The comparison below presents the original SPSS interface, captured during the workflow observation session in which the participant demonstrated their everyday use of the tool.
Next to it, the redesigned version illustrates how the same structural elements can be reorganized to establish a clearer visual hierarchy and reduce cognitive load.
Original
Redesign
Design System
The design system and overall UI were kept minimalistic on purpose, allowing the interface to remain in the background and not distract users from the complex analytical tasks within the tool.
User Flow
The following section shows the redesign along the core user flow:
  • Duplicate a calculated dataset into the Publication section
  • Open the publication workspace and select the dataset
  • Open the chart editor
  • Create the chart
  • Insert it into the publication
  • Add a source reference
1. Duplicate to Publication
The first screen displays an overview of existing datasets within a project folder. The dataset “Test der Innersubjekteffekte” is shown with its context menu open.
By selecting “Duplicate to Publication,” a new folder is automatically created within the publication section, and the dataset is placed inside it.
2. Publication Workspace
After selecting the newly created folder in the sidebar, the publication workspace becomes visible. Below the dataset card, a floating toolbar appears, offering functions such as Insert Heading, Text, Graphic, and Footnote. These tools allow the user to structure and expand the publication document directly within the system.
Opening the card menu in the top right corner reveals additional actions. Selecting “Create Chart” opens the chart editor in a modal overlay, enabling visualization without leaving the publication context.
3. Chart Editor
After selecting “Diagramm erstellen,” the chart editor opens as a modal overlay. Previously calculated datasets can be visualized by selecting the relevant parameters, which are highlighted once activated.
The editor provides control over chart type, color, axes, and additional visual properties. This feature directly addresses a key pain point identified during the interviews by enabling refined visualizations within the same environment. Users can create and export publication ready graphics without switching to external tools.
4. Create Chart
After selecting the parameters, the user switches to the preview tab to review the chart with immediate visual feedback. In this state, a bar chart is active, while additional chart types remain available.
Hovering over an alternative option generates an automatic preview based on the selected dataset and parameters. Once the desired visualization is finalized, selecting “Anwenden” inserts the chart directly into the publication document.
5. Chart Inserted
The generated chart is added to the publication document as a graphic section, positioned directly below the dataset. If required, the original data section can be removed at this stage if needed.
Additional sections can then be inserted, such as a source reference or descriptive text elements that contextualize the visualization.
6. Add Footnote
A footnote is inserted in a section below the chart to reference or contextualize the visualization. Formatting options such as bold, italic, and headline styles can be applied directly through the toolbar to structure the content as required.
Key Improvements
The redesigned concept introduces several improvements that streamline research workflows and reduce reliance on external tools.
1.A simplified and more reliable publication workflow
The publication process is based on a predefined block structure consisting of text, graphic, footnote, and other content elements. These blocks function as structured tokens that are automatically adapted during export to match the formatting requirements of the selected journal.
2.Automated formatting across multiple journal guidelines
Once created, the content functions as a reusable structural source. It can be exported in different layouts, with the system automatically applying the specific formatting rules of each journal. This eliminates repetitive manual adjustments when submitting the same study to multiple publishers.
3.Flexible and refined chart creation
Users can generate highly customizable visualizations directly within the system. The chart editor provides detailed control over visual parameters.
Prototype Userflow
Here is the user flow described above presented as a screencast.
Reflection
This project was conceptually and technically demanding. It marked my first in depth engagement with dashboard systems, statistical analysis tools, and scientific research workflows. Understanding different chart types, their appropriate use cases, and the relationship between structured datasets and visual representation required extensive exploration.
Designing an interaction model that allows users to select parameters, modify them dynamically, and receive immediate visual feedback involved multiple iterations. Translating numerical structures into flexible yet controlled visual outputs proved to be one of the central challenges.
The concept would benefit from further validation through user testing with researchers to assess clarity, efficiency, and practical applicability. In addition, consultation with academic publishers would be necessary to verify technical feasibility and formatting requirements.
Overall, the project strengthened my ability to navigate complex systems and translate analytical processes into structured interaction models. With further refinement and testing, the concept has clear potential to improve the research and publication workflow.